The campaign support page contains a myriad of useful information, links to the VIP Backend and the Distribution Center, and how-to guides on using each of the systems. The support page also lists the necessary info for linking to the experience depending on the campaign you are running.
The VIP metric dashboard contains most of the information you will need for any given campaign. Information contained in the VIP backend is mapped out in its entirety on the Data Legend page. You can view and pull the information you need from the backend, then match key metrics such as personal information, goals tracking, and Opt Ins to their matching counterparts in the data legend (see below).
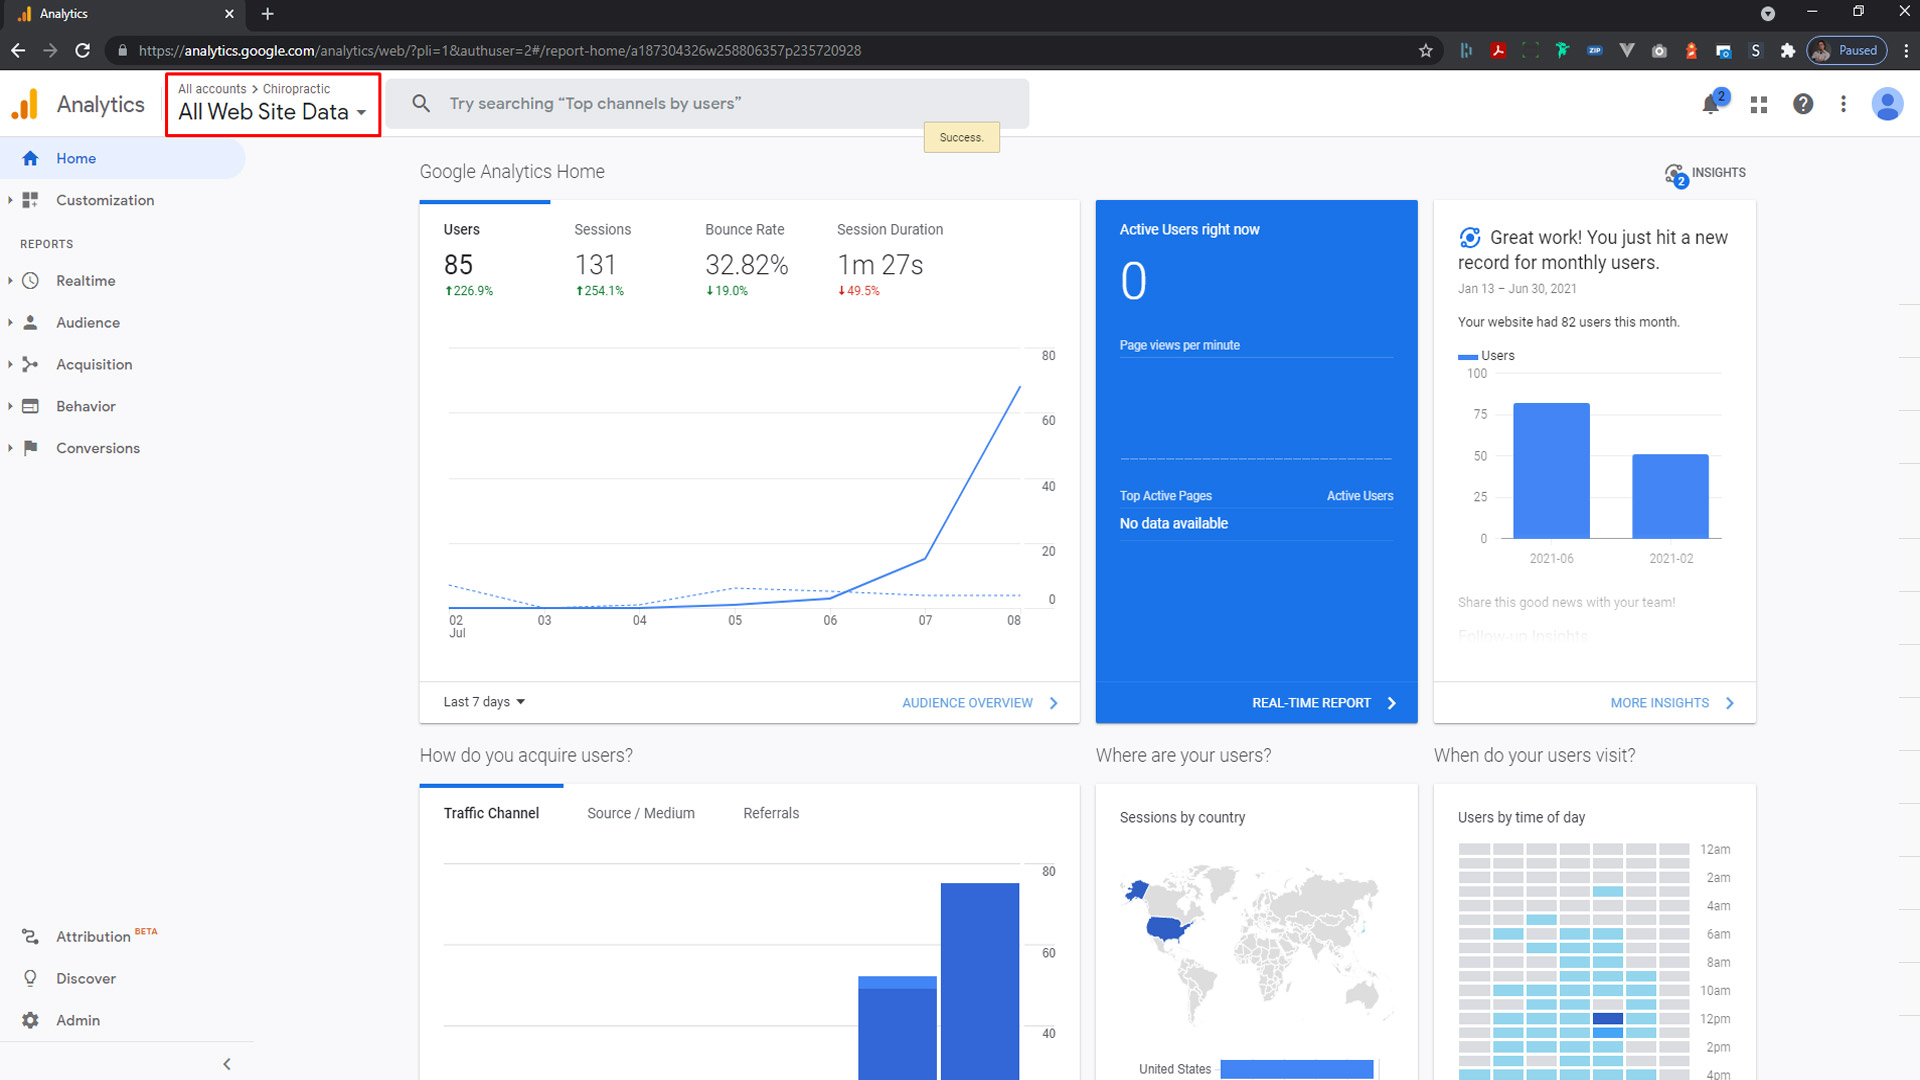
We also include Google Analytics for capturing other side data that may also be useful. From Google Analytics, you can see visitor's geographic data, which devices they are visiting from, and how long they stayed in the experience. You can access GA from within the VIP Metric Backend in the left hand menu. Analytic information is separated by campaign.
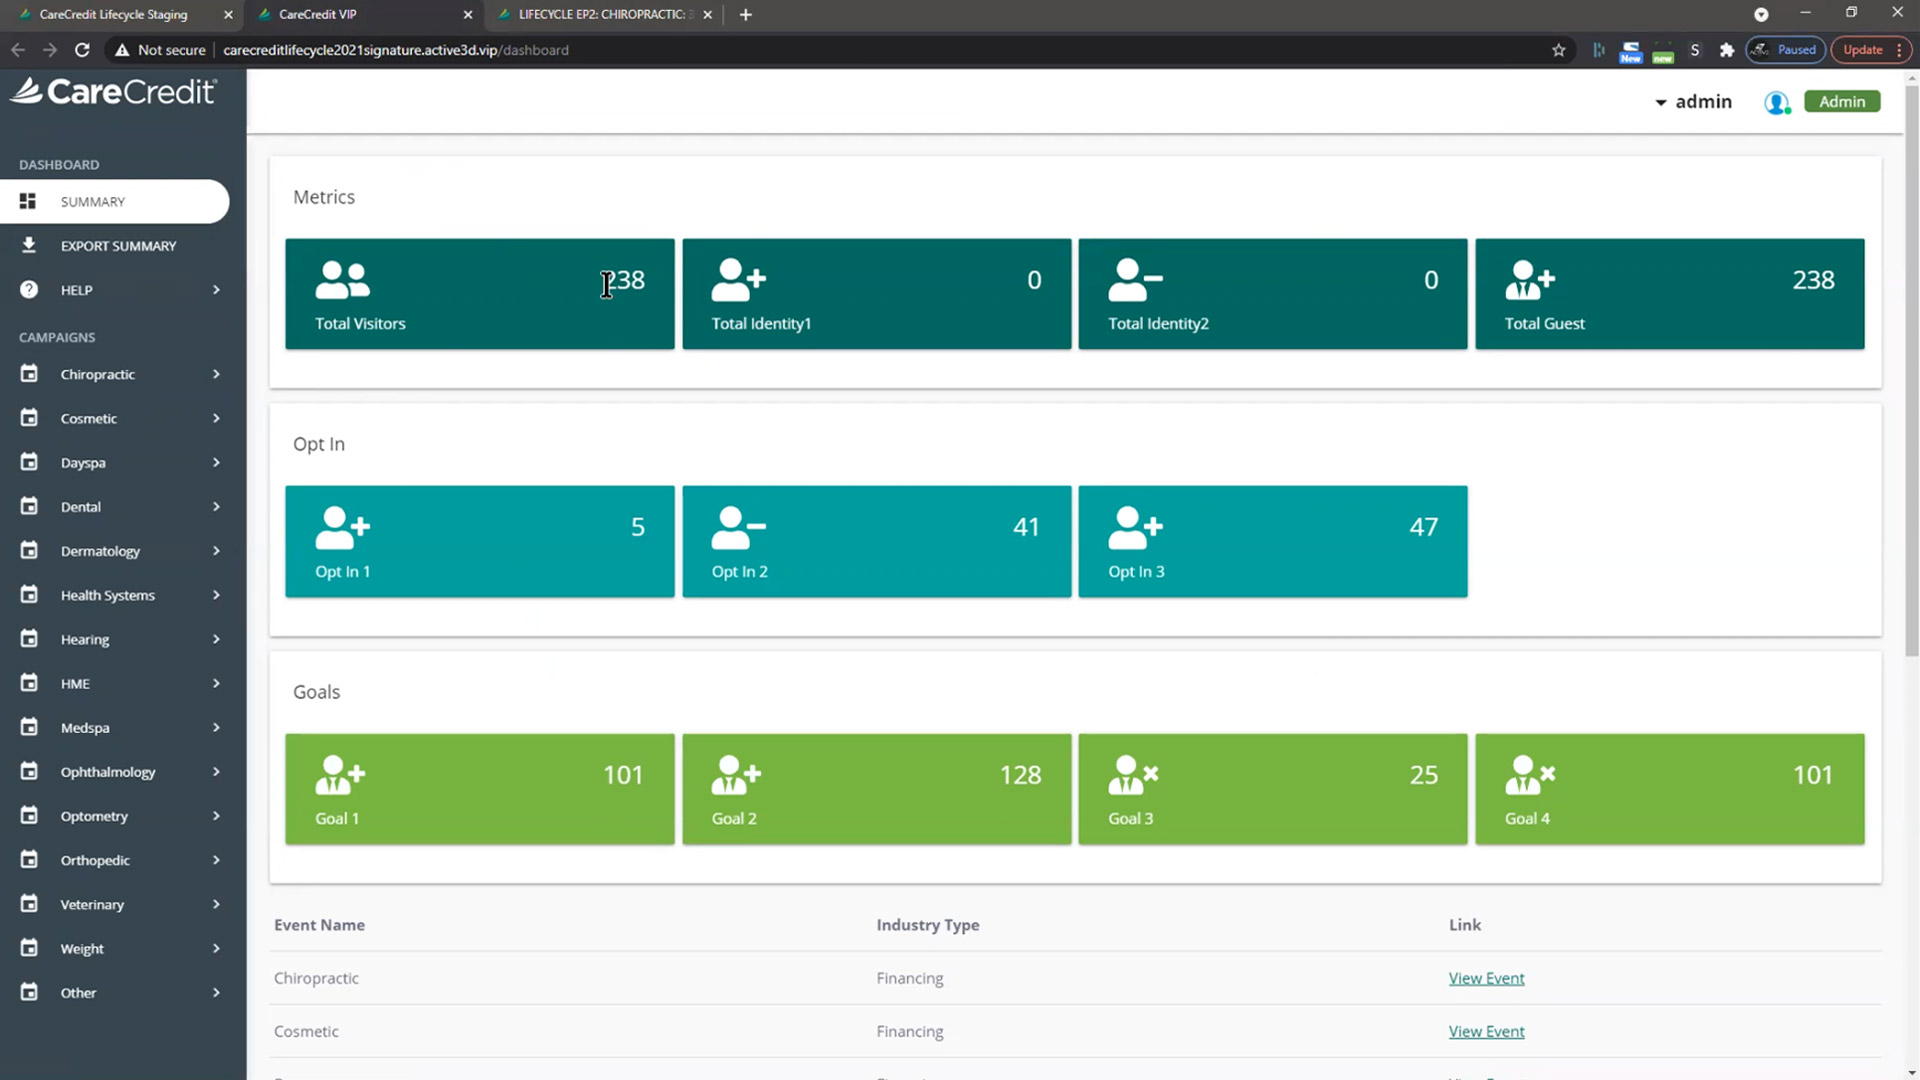
When first opening the VIP Dashboard, you can easily pull total visitor numbers, how many opt ins you have for each opt in offered, and goal metric tracking. To see what each goal is mapped to, reference the data legend.
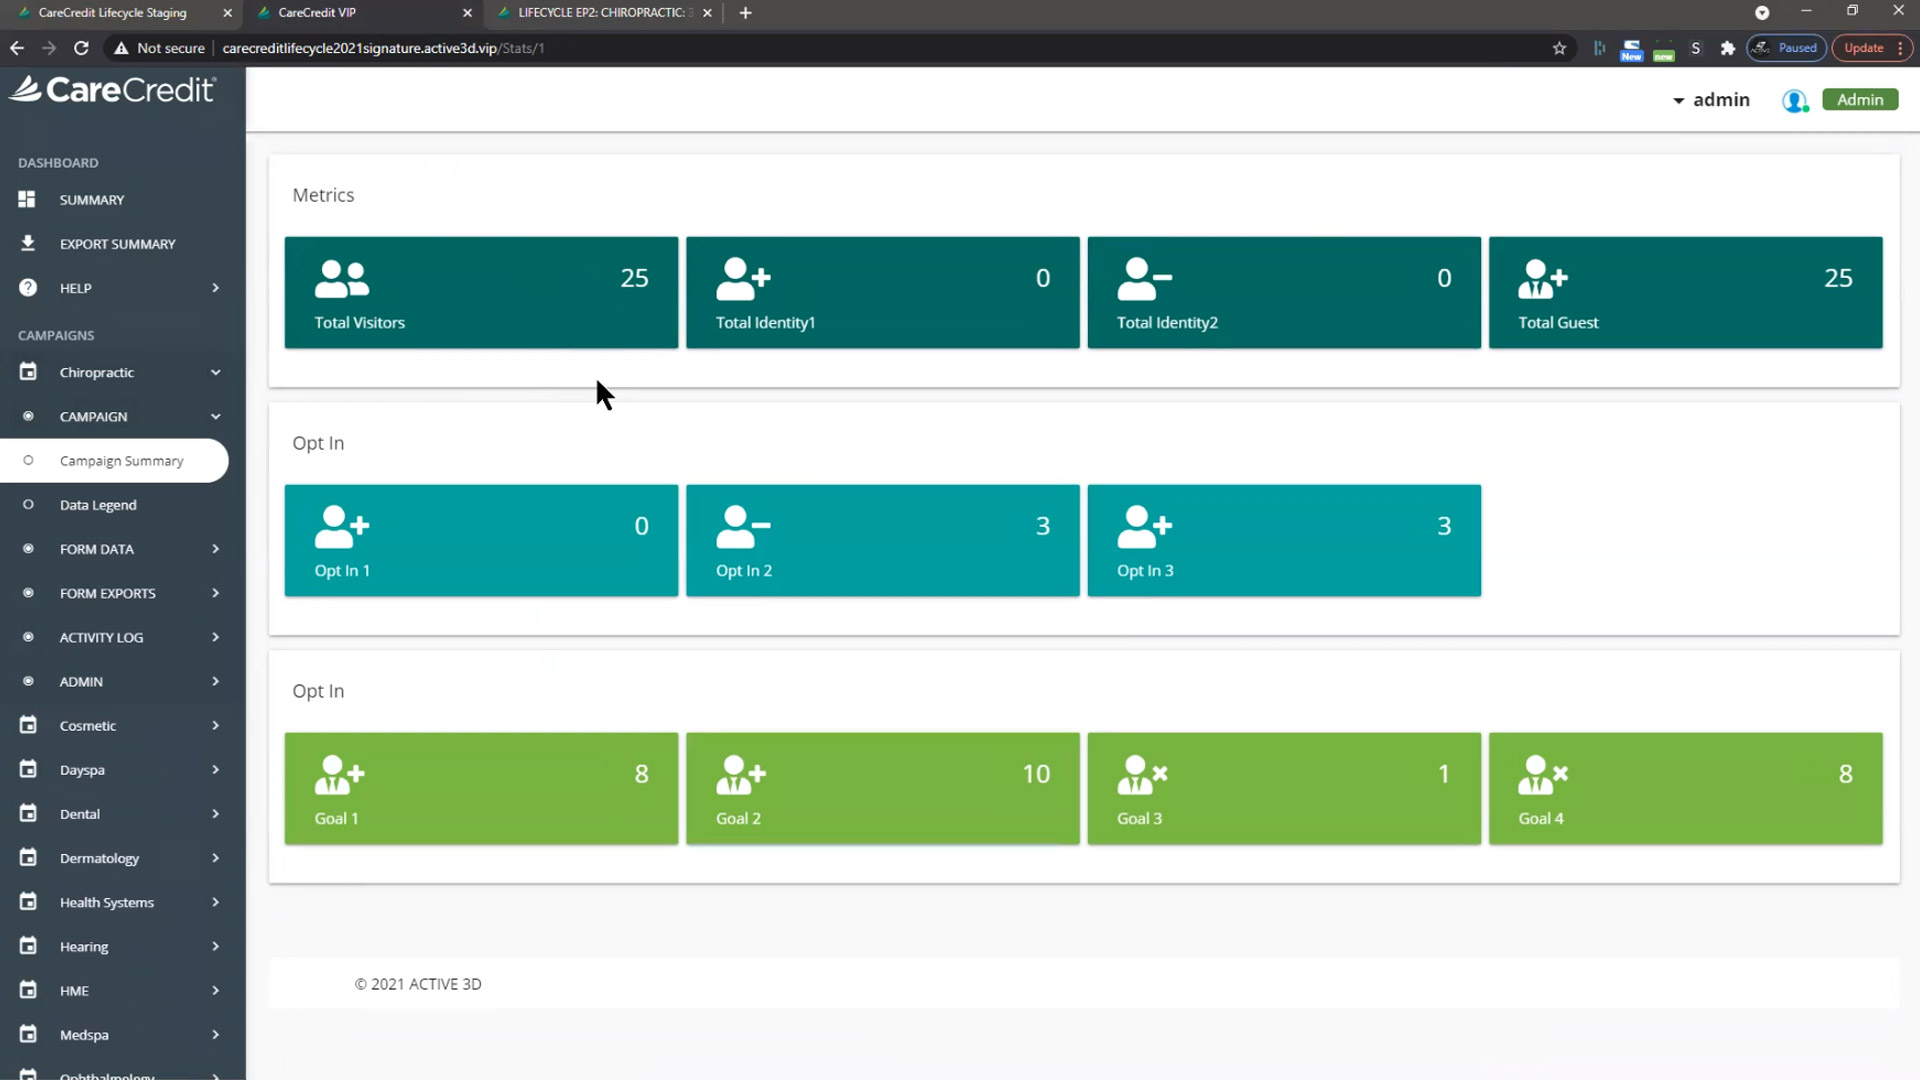
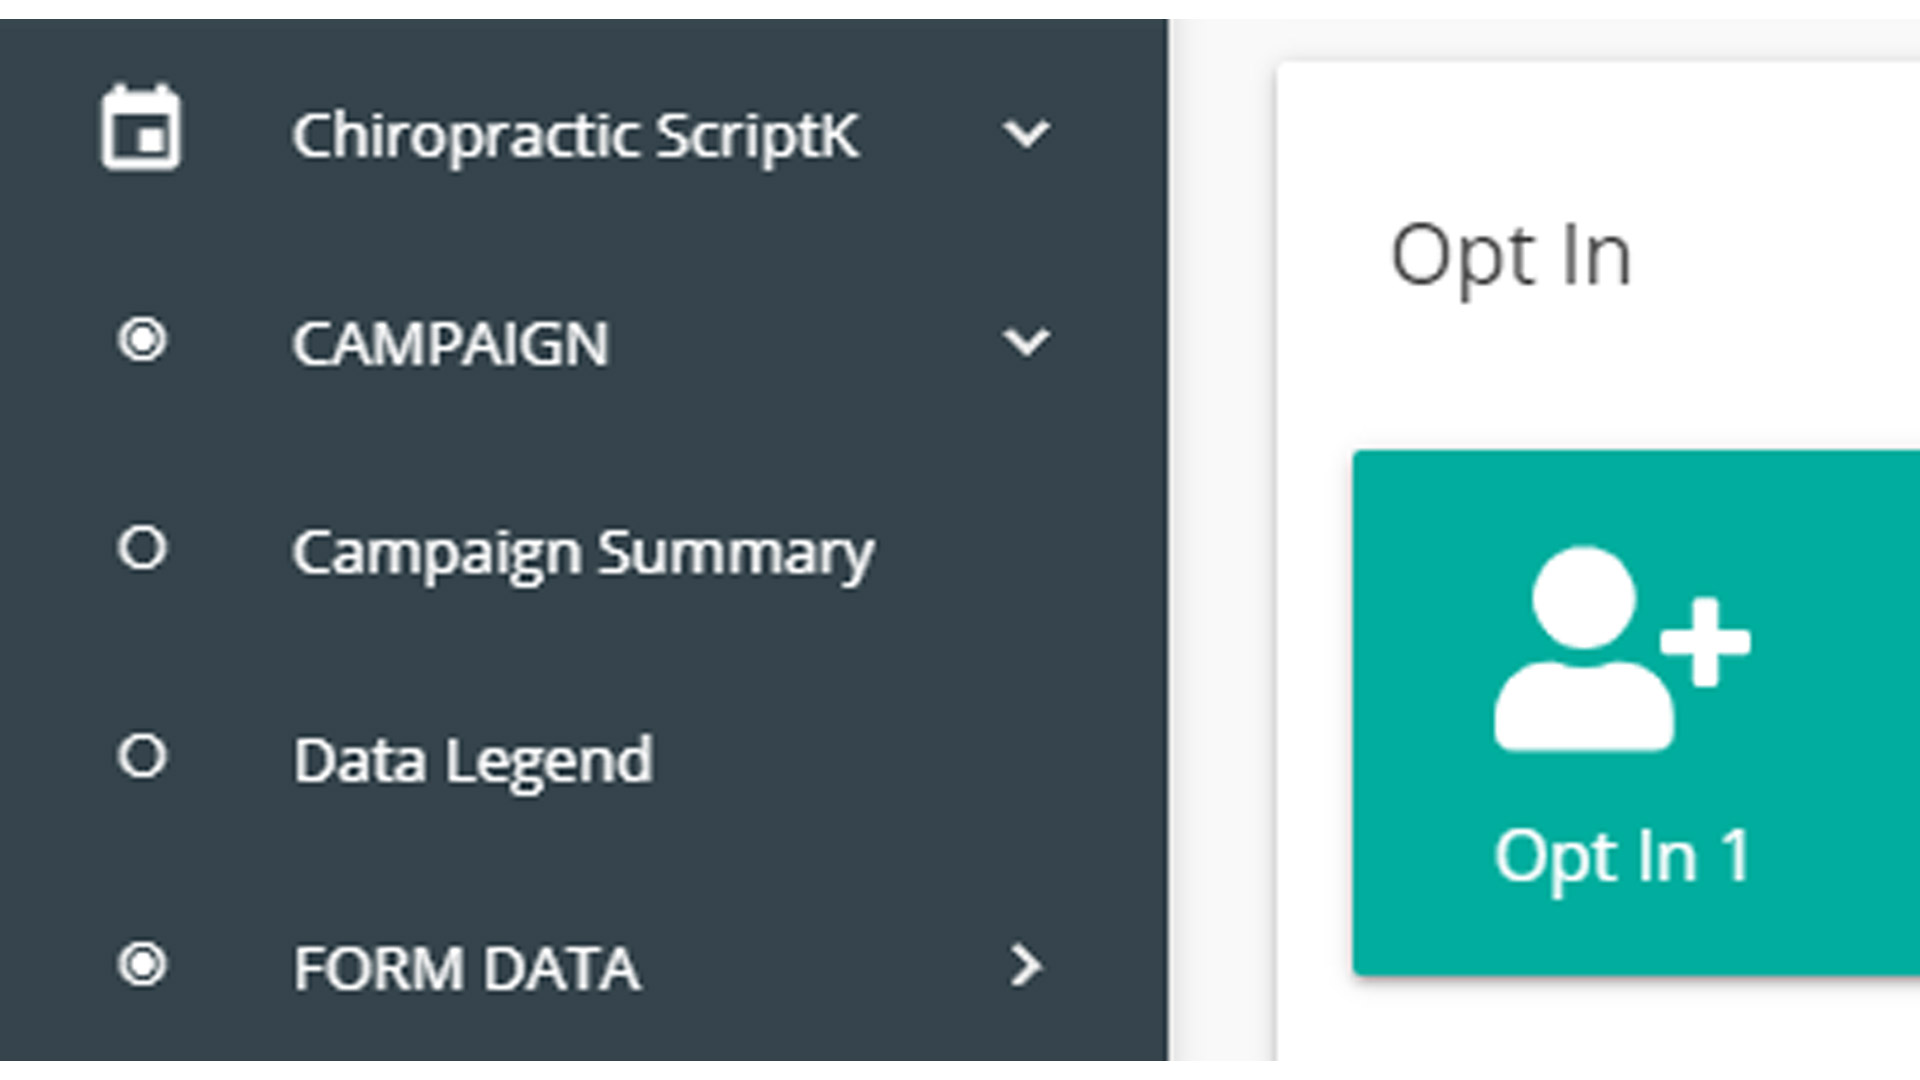
You can also see the summary for any individual campaign by opening the campaign's dropdown and selecting Campaign Summary.
Click to Expand
THE LEFT-HAND MENU
The main method of navigation is available in the left hand menu. You can access most of the functions of the metric dashboard from this menu.
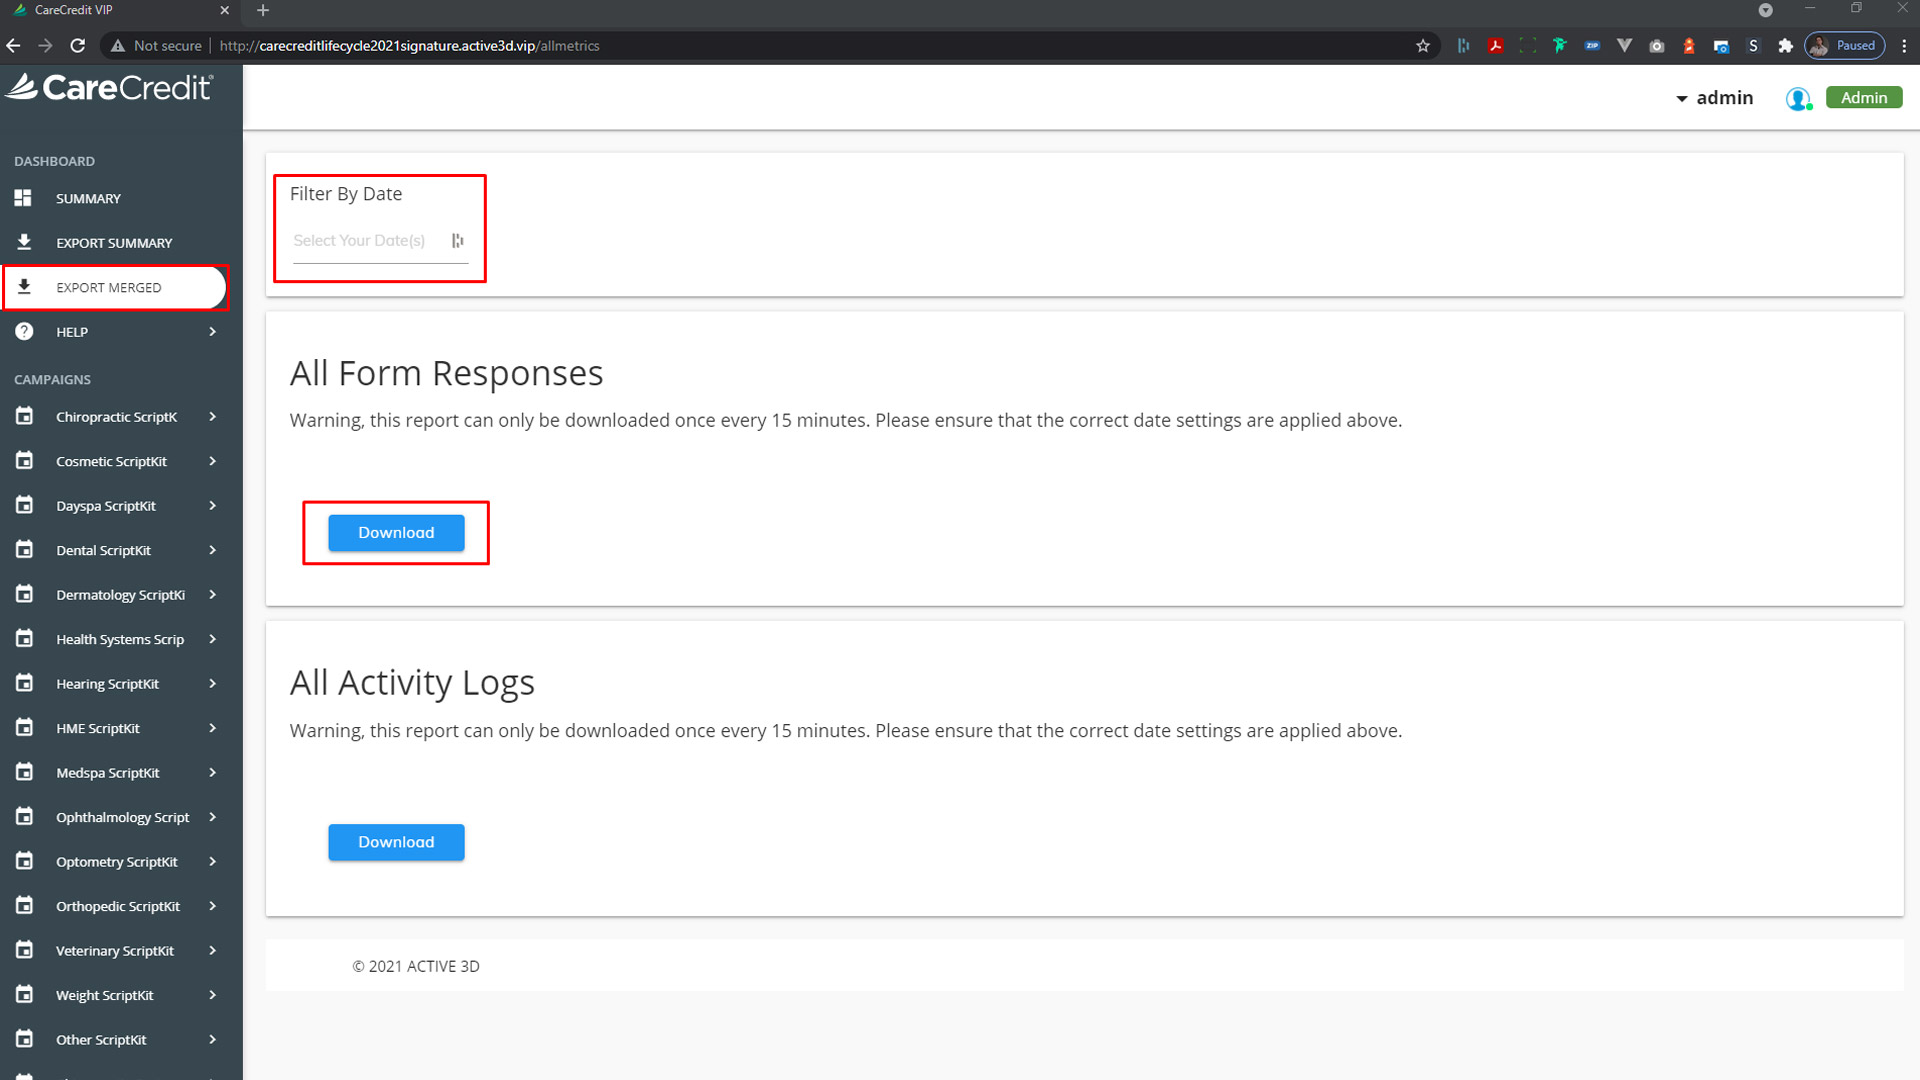
EXPORT SUMMARY : Exports a breakdown of the summary numbers (total records, guests, returning, etc.) EXPORT MERGED : Exports all records from every experience in the left hand menu.
Additional functions and views are available in the dropdown for each campaign.
Click to Expand
CAMPAIGN FUNCTIONS/VIEWS
Under each campaign is a specific set of functions/views that are specific to that experience.
CAMPAIGN : See an overview of the visitors and goal completions or view the legend for the data the experience has collected. FORM DATA : View all form data received. You can also filter by date and remove test records with the hide function. FORM EXPORTS : Export form data to a CSV file. This file can then be opened by Excel or Google Sheets for further data analytics. ACTIVITY LOG : Export a break-down of all interactive elements clicked or view the Google Analytics for the experience. ADMIN : Unhide records removed from the Form Data view.
FORM DATA AND ACTIVITY LOG
Click to Expand
FORM DATA
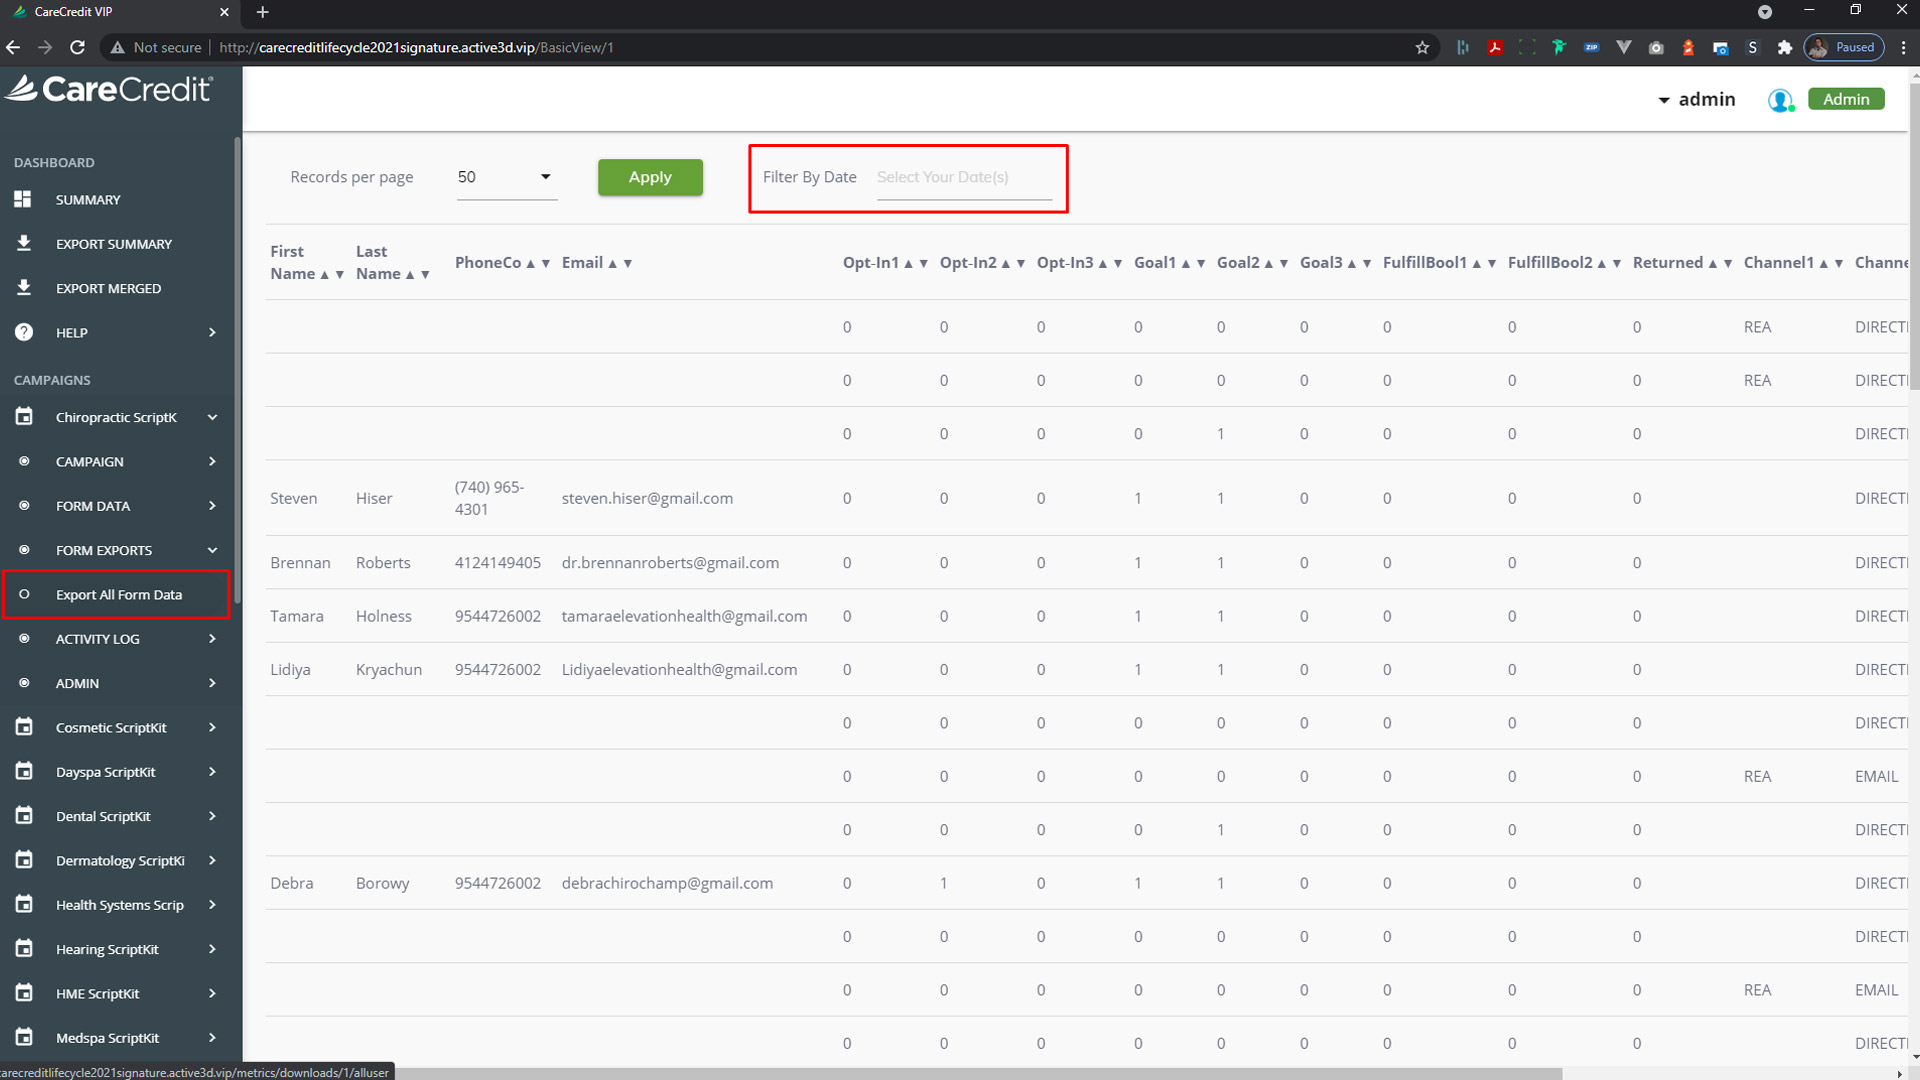
The main form data view contains most of the important information you will need. This view shows you campaign goal tracking, personal information, and from where they visited the site for each unique visitor to the experience.
You can view the form data in the metric dashboard by clicking FORM DATA > View All Form Data or export the data as a CSV file by clicking FORM EXPORTS > Export All Form Data
IMPORTANT : Campaign goal tracking is one of the most important metrics when gauging the success of a campaign. The goal tracking slots are always reserved for key moments in the experience such as completing a form or downloading an important asset.
ACTIVITY LOG
The activity log is a more thorough breakdown of all unique interactions the experience had. Each time a user clicks on something in the experience it generates a new row in this log. From here, you can see how many times users accessed any given modal, asset, or video.
You can download the data from the activity log as a CSV file by clicking ACTIVITY LOG > Export Activity Log
EXPORTING DATA FROM THE VIP METRIC DASHBOARD
Click to Expand
EXPORTING CSV DATA BY CAMPAIGN
A preset function is available to you in order to quickly export the data from any given campaign. From the left-hand menu, open the campaign dropdown and select FORM EXPORTS > Export All Form Data.
If you would like to pull data from only a certain time period, select FORM DATA > View All Form Data, set a date range using the Filter By Date area at the top of the page, then click Export All Form Data
IMPORTANT : Before pulling full exports of data, it is advised that you first remove any tester records. See HIDING TEST RECORDS below.
Click to Expand
EXPORTING ALL CSV DATA AT ONE TIME
To export all data from every campaign at one time, select EXPORT MERGED from the left hand menu. You can then choose to export form responses, the activity log, or filter your export by date.
HIDING TEST RECORDS
Click to Expand
HOW TO HIDE UNNECESSARY RECORDS
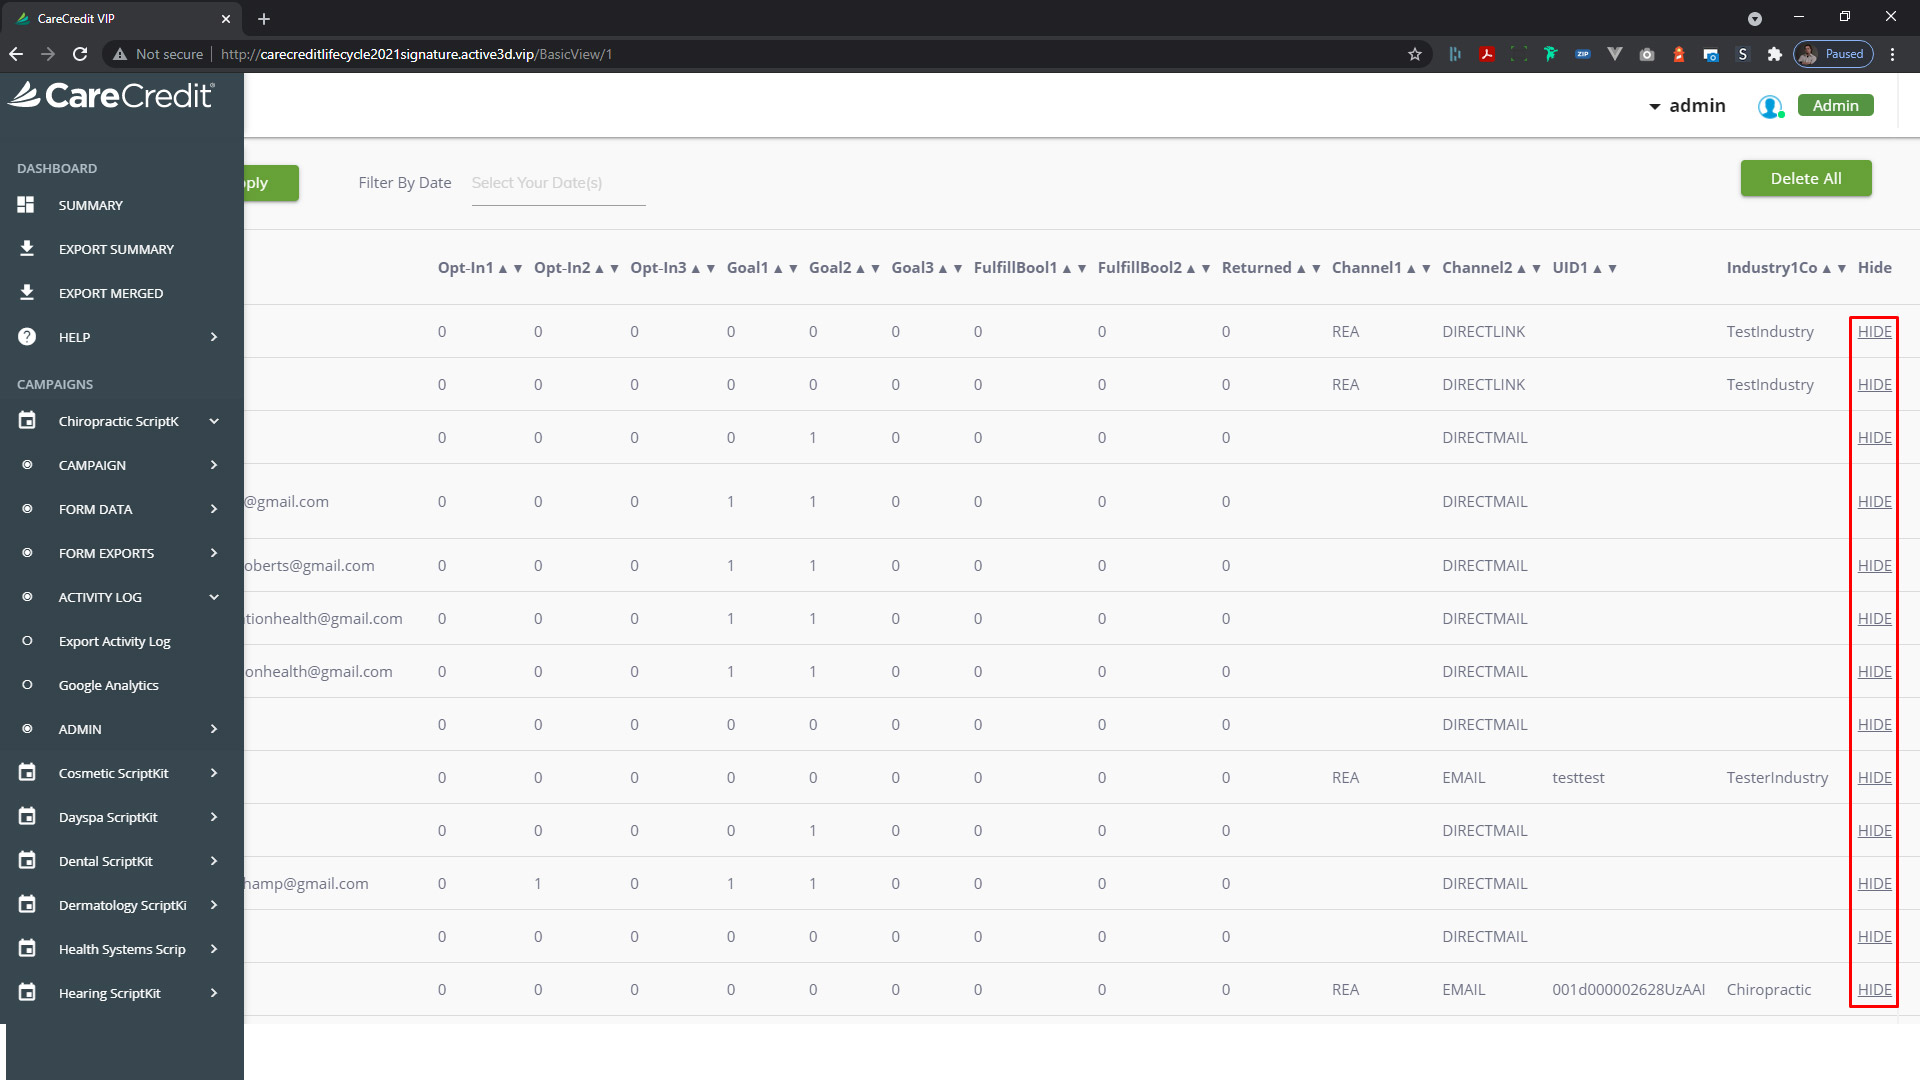
Before pulling data for any given experience, you will first want to remove any erroneous or test records. To remove these records, click FORM DATA > View All Form Data in the left hand menu, scroll your browser window to the right side of the page, and click HIDE on the record. This will then remove the record from the main table and place it in a quarantined status.
Click to Expand
WHEN TO HIDE RECORDS
Whenever the experience is being tested, it is best advised to put information into the form that reflects that this visit was a test. Search in the data for records that have test in the first/last name or email fields or have phone numbers or emails that seem to be someone testing the form.
USING GOOGLE ANALYTICS
Click to Expand
LOG IN TO YOUR GOOGLE ACCOUNT
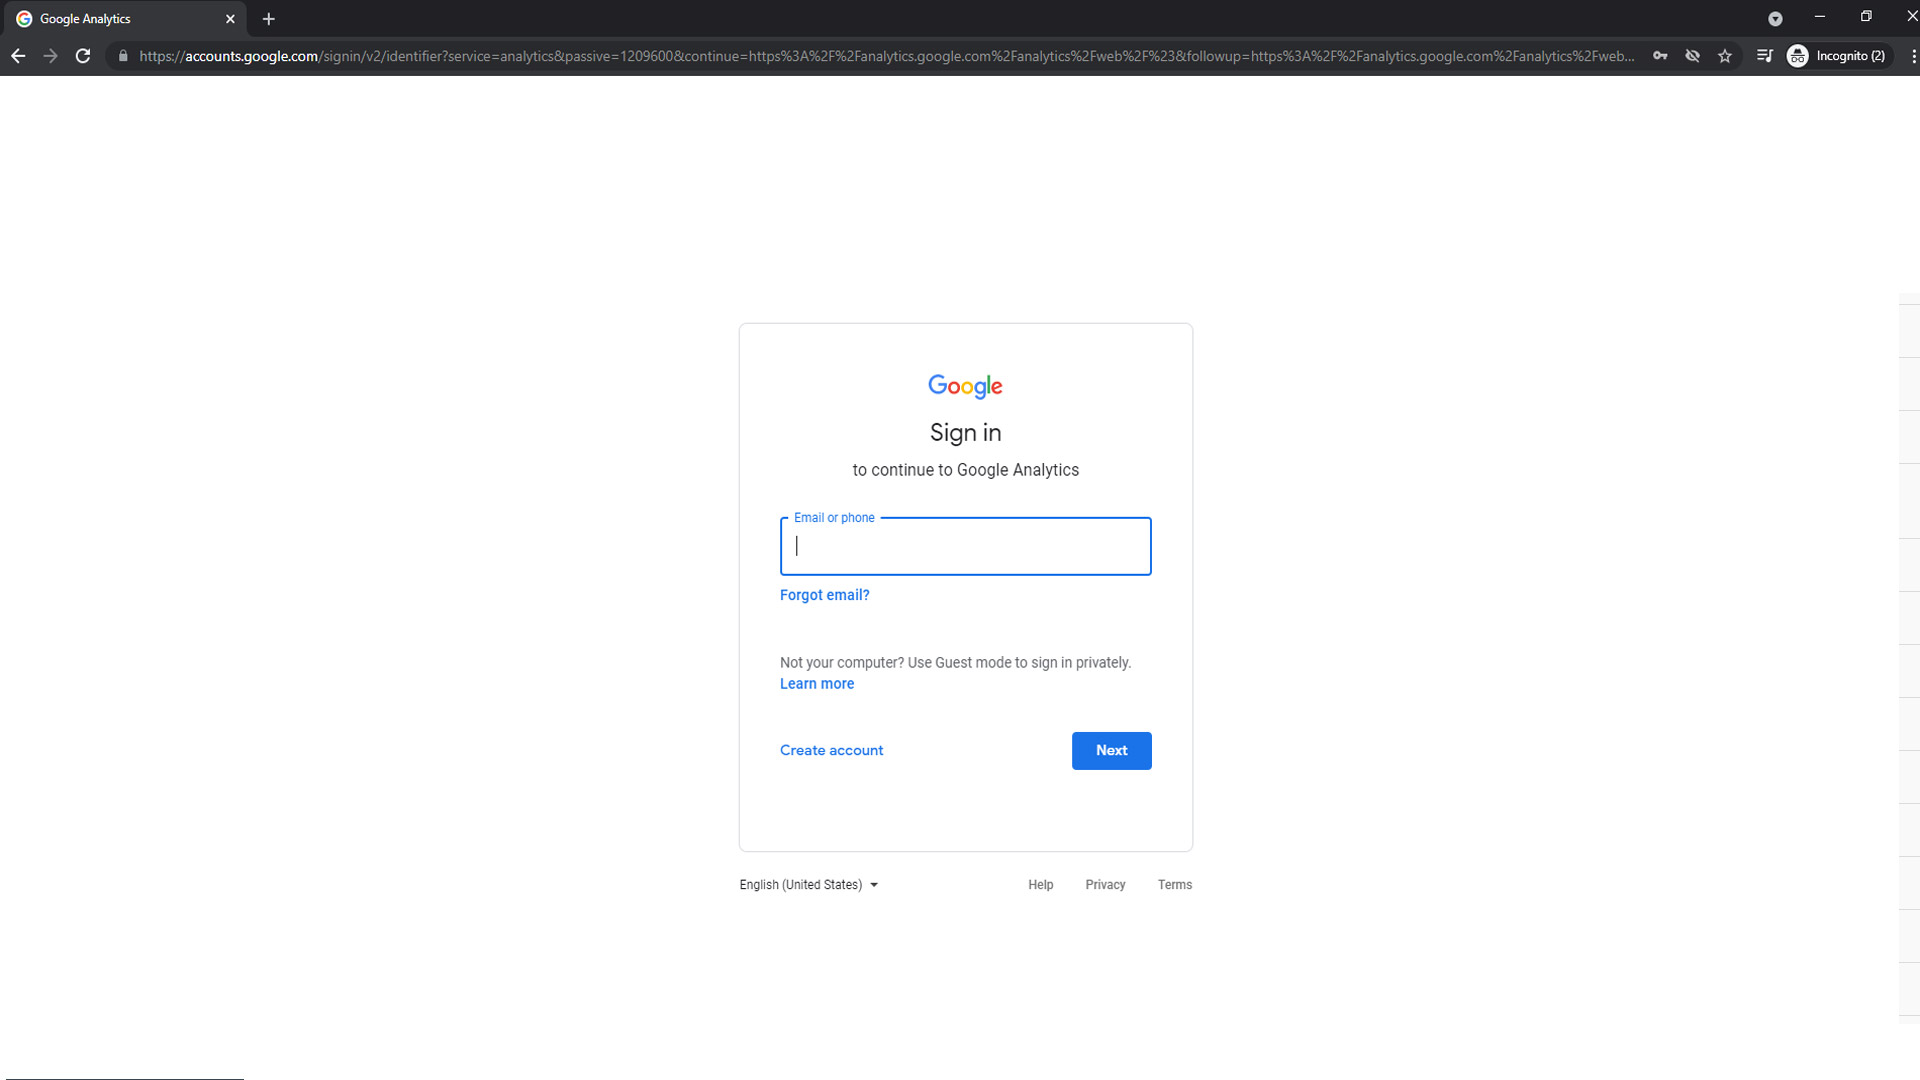
Using either the link in the VIP Metric Dashboard, or the button below, visit the Google Analytics site and log-in using you Gmail address. Whenever your Gmail address has been added to an analytics account, you will be notified via email.
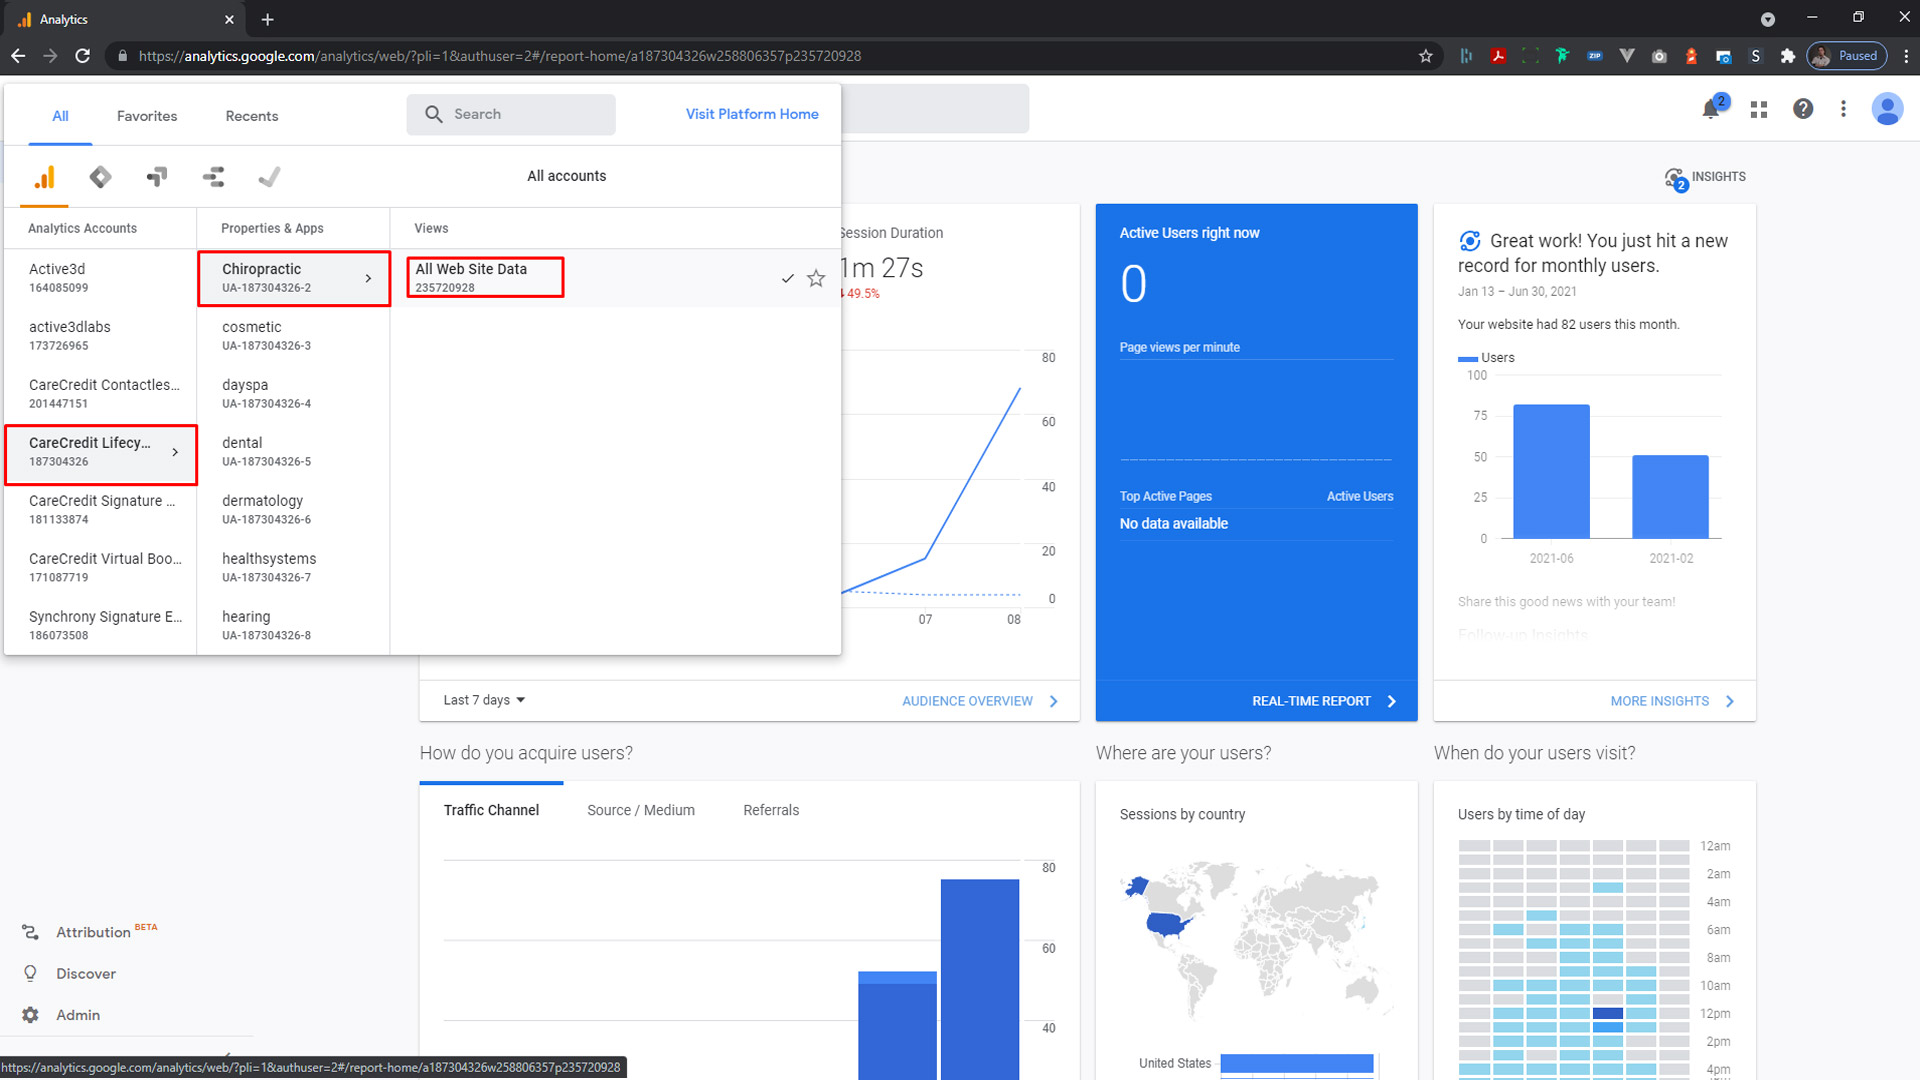
Hover over the site selector in the top left corner to open the panel.
Click to Expand
SELECT AN EXPERIENCE
Using the fly-outs, select an experience from the list available. If you do not see the experience you wish to view, you may have not been added yet.
Click to Expand
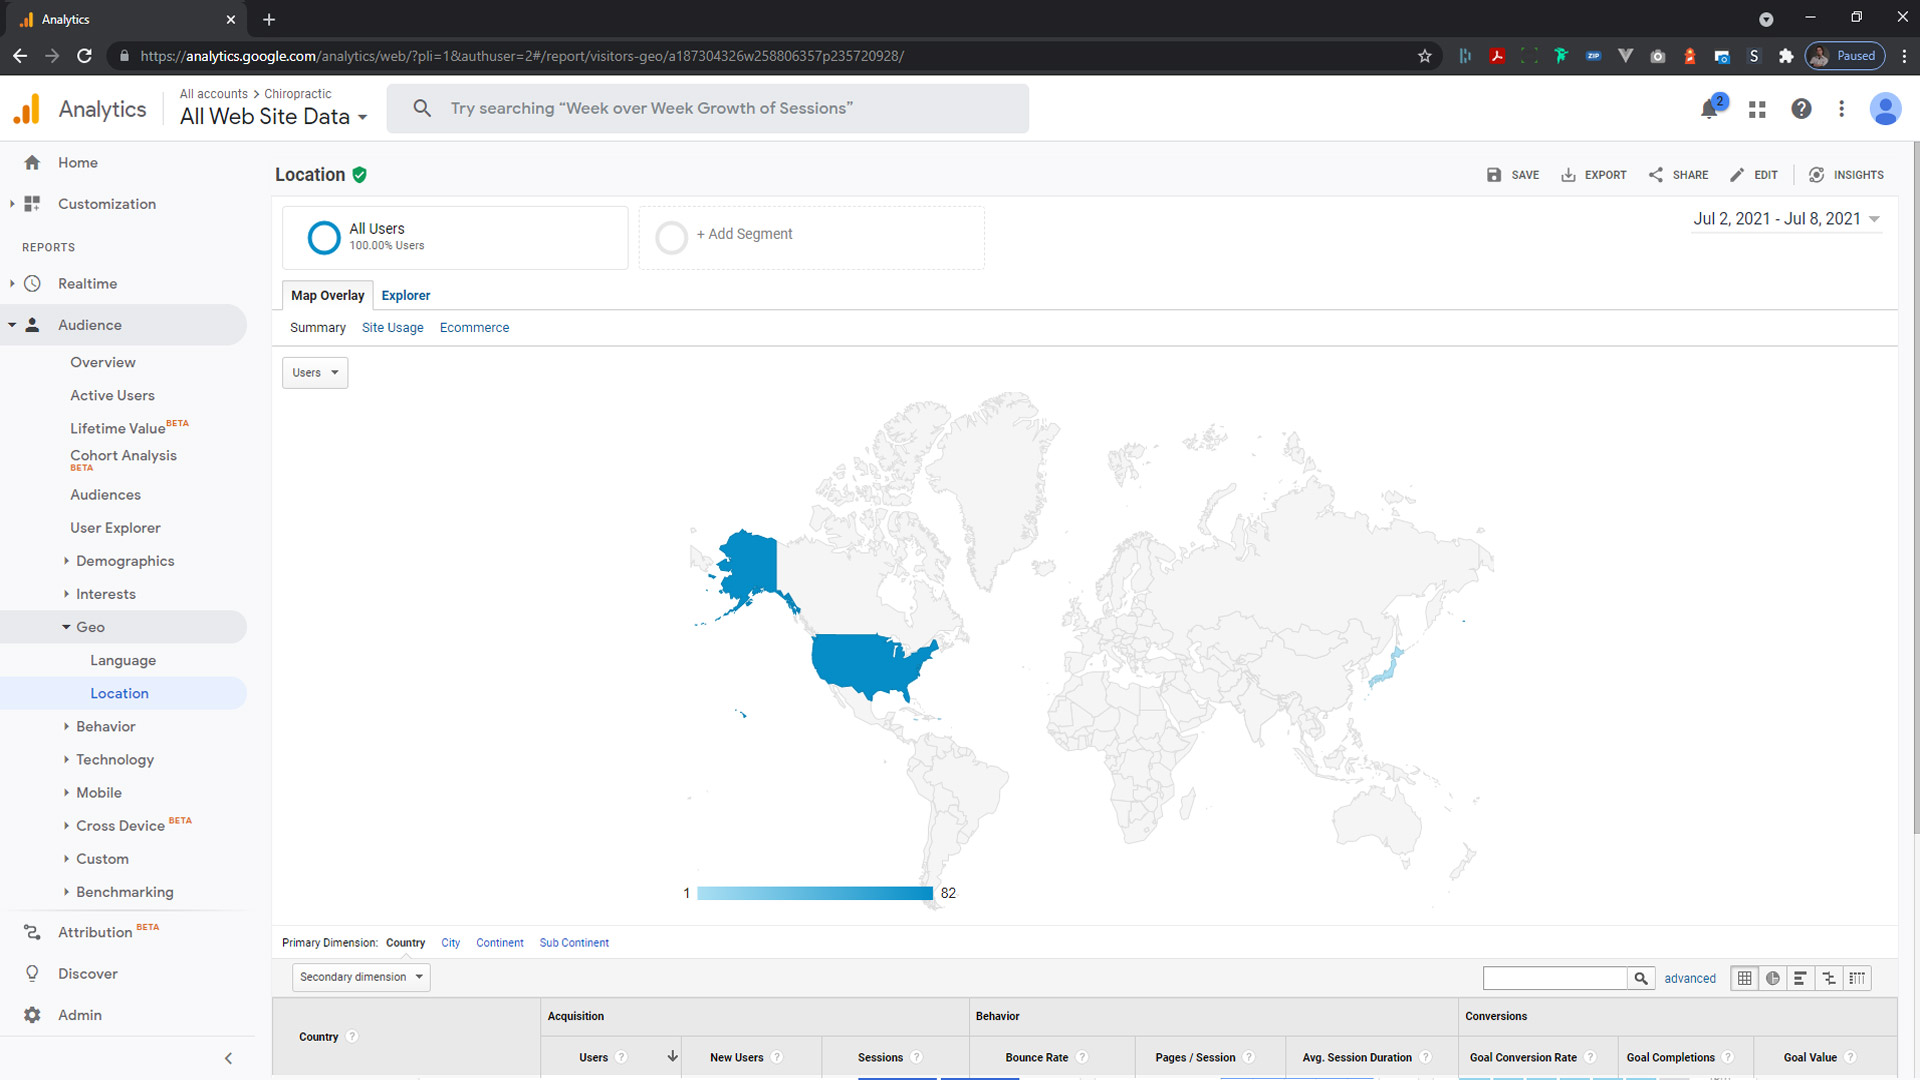
VIEWING GEOGRAPHIC DATA
To see where visitors to your experience are from, click Audience > Geo > Location. You can then select the country of origin your users are from to see more in-depth data about their location.
IMPORTANT : By default, Google Analytics shows you data from the last week or month. Ensure that the date range in the top right of the screen is set to the range you want to see. Launch dates of experiences are on the landing page of this site.
Click to Expand
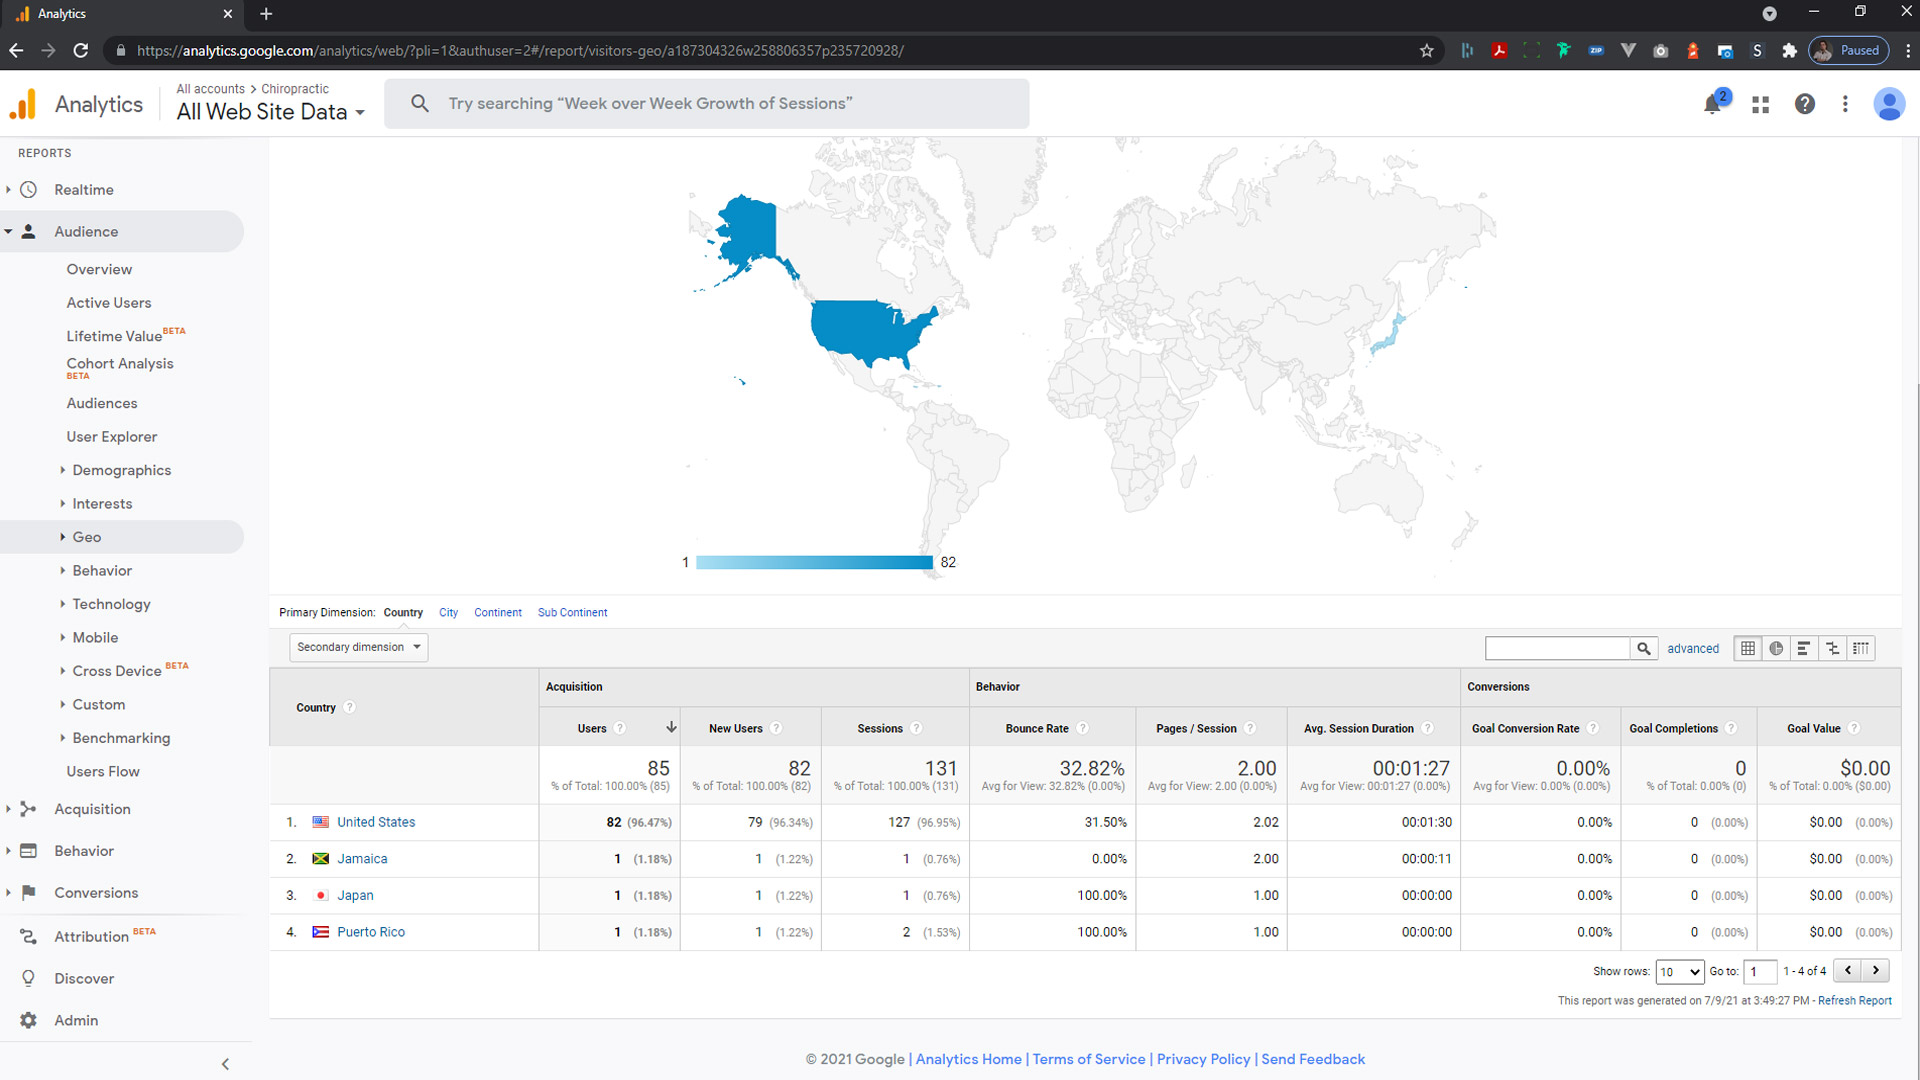
DWELL TIME
If you scroll down this page, you can also see another key metric, dwell time. This is how long the users spent exploring the experience. It is best advised to assume this time measurement is 20% below actual dwell time as testers who only visit the experience to insure a link or QR code is working are counted as 0 seconds, bringing the average down.
KEY METRICS
WHICH METRICS TO LOOK FOR WHEN SUMMARIZING A CAMPAIGN
GOALS : These are the main, predetermined goals of the campaign. Their mappings can be found in the data legend.
OPT-INS : These are the elements on the main form indicating the user wants one of your offerings. Their mappings can be found in the data legend.
CHANNEL : This is where the visitor came from when visiting the experience (ie: Direct Mail, Social Media, Print Campaign)
EVENT CODE : This is the code that is passed to the experience from the link they used to visit. This can be used to correlate which email/social campaign the visitor clicked.